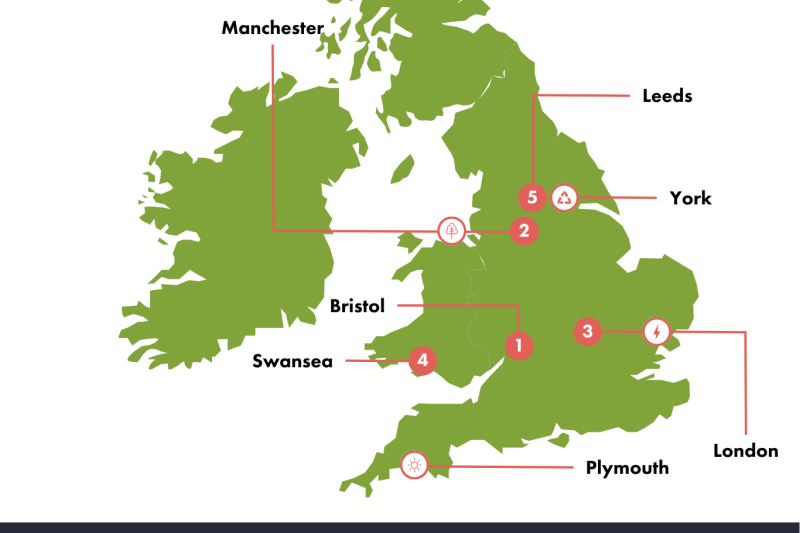
When lockdown occurred, we managed to cut carbon emissions by 7% – but global warming is still a concern for the future of our planet. By 2050, the goal is to achieve net zero emissions and cities across the UK play an important role in becoming more sustainable.After analysing locations up and down the country, we’ve compiled a list of the “greenest” regions in the UK.
Who made the list?
Bristol made it to the top of the leaderboard. The city invested an impressive £10,462 per million pounds of the Bristol Council’s budget in solar energy. Not only did it score 14 points for its solar energy investments, but it also had the highest percentage of green space and parks in the city at 24.02%.Manchester is a close second, with 20.42% of the city comprising parks and green spaces. On top of this, it reuses, recycles or composts a respectable 38.8% of its rubbish, so it’s no surprise that the air pollution in this city is only at a level 2.Taking the last spot in our top three is London, which has invested £1,443.47 per million pounds of the London Council’s budget in solar energy. The city reuses, recycles or composts 33% of its waste and has 1009.5 electric vehicle charging devices per 100,000 people, which it scored 15 points for.
How did we calculate the scores?
We evaluated the UK cities based on these 4 categories:
- Nature
- Transport
- Emissions
- Sustainability
And, within these categories, we analysed:
Nature
What percentage of each city comprises green spaces and parks? This percentage was calculated by researching the area of the region and the total area of parks in the city.
Transport
How many charging devices are there for electric vehicles per 100,000 people? This data was sourced using the information provided by the gov.uk charging map.
Emissions
Air pollution ratings and forecasts. Lower numbers equate to a better rating. This data was collected from the gov.uk forecasting tool.
Sustainability
Our understanding of a city’s sustainability is based on the percentage of waste that each city recycles. These figures were calculated by comparing the total amount of waste with the percentage of what each city recycles, reuses or composts.We also measure how sustainable a city is by analysing the amount of money invested in solar energy per million pounds of the city council’s budget. This includes any expenditure on the construction or maintenance of both new and existing solar energy projects. The information for solar investments was investigated by thesolarcentre.
Our Methodology:
After collecting stats on this criteria, we ranked each city from 1-15 on each factor. Where cities had the same score, ‘solar investment’ had a heavier influence on deciding their position, given Project Solar’s mission. An average score was taken and from that, the city that achieved the highest number of points was deemed the greenest city!As we all work together to achieve net zero emissions by 2050, we’ll be keeping an eye on the progress of the cities across the UK, particularly the growth of solar. If you’re considering swapping to solar power, contact our team for more advice and information.

